The wasteof trolley problem project.
In the month of October, me and @imadeanaccount worked on a project that regarded the world-famous trolley problem. I surveyed wasteof users, getting their kill counts whilst @imadeanaccount made the graphs.
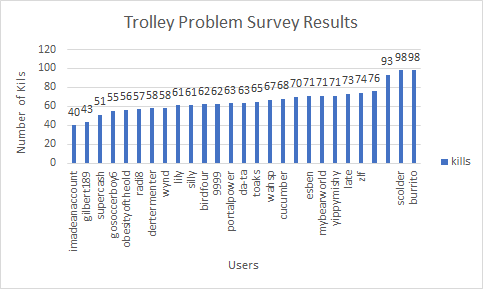
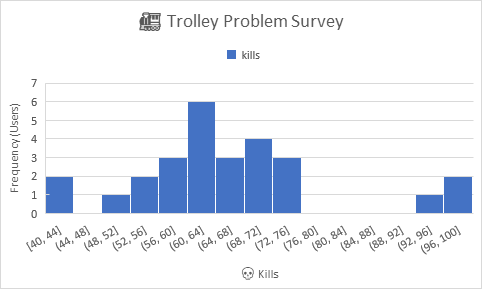
The final graphs:
These are the final graphs for the wasteof trolley project. You can notice how the results are more randomised, and in contrast to the political compass project, there is no clear demographic for wasteof users. The trolley problem is a unique problem where kill count can still drastically vary even if the individuals have similiar authority levels on the political compass.
A huge thank you for @imadeanaccount for doing the graphs, they deserve more credit than me. Finally, sorry that the content on here has been lacking in the past few months - I lost interest in wasteof for a bit, then a few shit things happened and then I was revising for GCSE mocks. But from now to about April I should be pretty active on here, so stay tuned!
comments
ohhh so thats what that was for. sorry i didnt end up doing it lmao
anyways thats cool!! really interesting to see how good wasteof’s morals are